
Bitcoin Gearing Up for a Strong Recovery?

Bitcoin is making some notable moves as it has just undergone a sharp correction, dropping to a low of nearly $81,434 before recovering back above $90,000. Currently, the market is closely watching key resistance levels to assess whether BTC can continue its bullish run.
With a break above the downtrend line and trading above the 100-hour simple moving average, Bitcoin is sending positive signals of recovery. However, there are still hurdles to overcome before the market can confirm a long-term uptrend.
Bitcoin Begins Recovery After Testing Key Support
Bitcoin has undergone a correction from $95,000, breaking through key support levels at $92,000, $90,000, and even $88,000. The decline took BTC closer to $82,000, bottoming at $81,434 before strong buying pressure emerged.
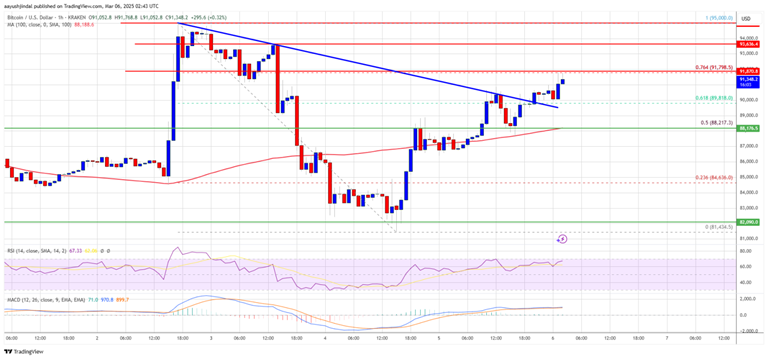
Source: BTCUSD on TradingView.com
Shortly after testing this key support level, Bitcoin price showed signs of recovery. Buying pressure from buyers helped BTC bounce above the $85,000 and $88,000 resistance levels, indicating that selling pressure has weakened. Another notable signal is that BTC has surpassed the 50% Fibonacci retracement level of the decline from $95,000 to $81,434.
Not only that, Bitcoin has also broken above the bearish trend line on the hourly chart of the BTC/USD pair, a sign that the uptrend could continue to consolidate. The price staying above the 100-hour simple moving average is also a key support factor for the recovery scenario.
Important Resistance Levels for Bitcoin
Currently, Bitcoin is approaching the first important resistance zone at $91,800, which corresponds to the 76.4% Fibonacci retracement level of the recent correction. If BTC can close above this level, the bullish momentum could continue towards stronger resistance zones.
- First important resistance level: $92,500 – This is a level that could hinder the recovery if the buying pressure is not strong enough.
- Next resistance level: $93,500 – A breakout above this level would open the door for BTC to test the $95,000 region.
- Further Upside Potential: If Bitcoin breaks above $95,000, the next target could be $96,200 and even $98,000.
A strong breakout above $93,500 could confirm the bullish momentum, helping BTC regain momentum to continue its journey to conquer higher levels. Conversely, if Bitcoin is rejected at this resistance level, a correction could take place.
Downside Risks If BTC Fails to Maintain Upside
Although the market is showing positive signs, if Bitcoin fails to break above the key resistance level, the next downtrend could occur. In that case, the following support levels will play an important role:
- Nearest Support: $88,000 – If BTC falls below this level, selling pressure could increase.
- Next Strong Support: $86,200 – A break below this level could drag Bitcoin to $85,000.
- Important Support: $82,000 – If BTC fails to hold this level, the risk of a drop to $80,000 is very high.
Technical Indicators Confirming Current Trend
- Hourly MACD: Accelerating in the positive zone, indicating that the recovery momentum remains strong.
- Hourly RSI: Sustaining above 50, indicating that buyers are still in control.
Conclusion: Can Bitcoin Enter a New Bull Run?
Currently, Bitcoin is showing positive signs of recovery after a strong correction. If BTC can break above the $92,000 – $93,500 resistance zone, the price could continue towards $95,000 and higher. However, if BTC is rejected at key resistance levels, the risk of a drop to the $85,000 – $82,000 zone remains.
Investors should closely monitor BTC’s reaction at key resistance and support levels to determine the next direction of the market.