Solana (SOL) Faces Challenges – Can Bulls Hold?
Solana (SOL) is experiencing a volatile period as the price rebounded from the $114 support area but struggled to overcome key resistance levels. Currently, SOL is trading below $130 and the 100 hourly simple moving average, leaving many investors concerned about the next direction of the coin.
SOL Price Struggling Under Selling Pressure
After failing to hold above $155, SOL started a sharp decline, losing key support levels at $140 and $132. The decline pushed the price to a low of $114 before recovering slightly above $120 and $122.
A short-term rising channel is forming with support at $124 on the hourly chart of the SOL/USD pair. However, the bulls are still struggling to push the price above the key resistance levels at $128 and $130. The strongest resistance level at the moment is at $132, which coincides with the 50% Fibonacci retracement level of the drop from $151 to $114.
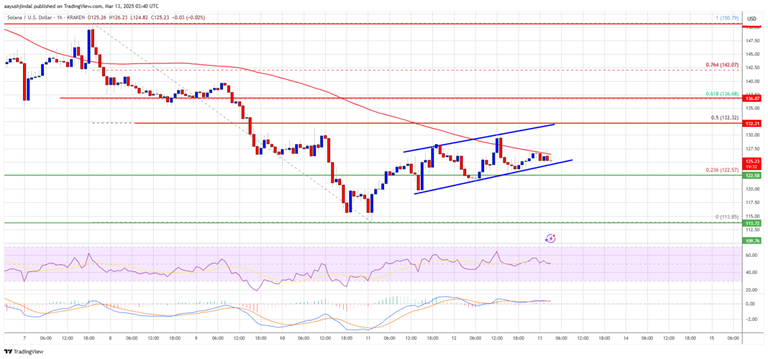
Source: SOLUSD on TradingView.com
If SOL can successfully close above the $132 resistance level, it could open a new bullish trend. In the bullish scenario, the price could approach the $140 area, before retesting the $150 level.
Risk of a decline if the key support level fails to hold
On the contrary, if SOL fails to clear $132, another bearish trend could be in the cards. The initial support is now at $124, with a key support zone at $120. If the price breaks below this level, SOL could continue to decline further towards $114. A close below $114 could send the market into a more negative mode, pushing the price towards the psychological support of $100.
Technical indicators
- Hourly MACD: Weakening in the bullish zone, indicating slowing momentum.
- Hourly RSI: Near 50, reflecting a balance between buyers and sellers.
- Important support levels: $124 and $120.
- Important resistance levels: $128 and $132.
Summary
Solana is currently in a consolidation mode and waiting for the next move from the buyers. A break above the resistance level of $132 could be an important signal to confirm a recovery, aiming at the $140 and $150 levels. Conversely, if the support level of $120 fails to hold, SOL could resume the downtrend, retesting the $114 area or lower. Investors need to closely monitor support and resistance levels to develop appropriate trading strategies.