Pump.fun Sees Sharp Drop Following LIBRA Incident, Memecoin Market Shaken

XRP Price Watch: Is a Breakdown Below $2.40 on the Horizon?

XRP
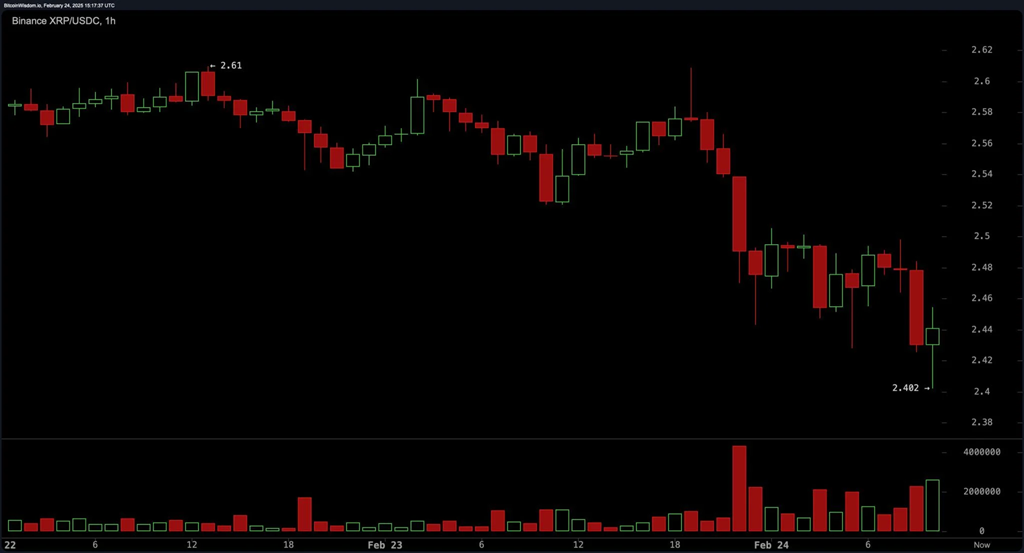
XRP’s one-hour chart reflects short-term bearish momentum, with the digital asset forming lower lows and struggling to break above resistance at $2.5. The support zone between $2.4 and $2.42 has seen multiple tests, while resistance at $2.5 to $2.52 remains intact. Volume analysis shows a pattern of increased selling pressure, with red volume spikes outweighing buying attempts. A rejection at $2.5 could signal further downside toward $2.4, whereas a successful reclaim of $2.45 with bullish candles may drive XRP toward $2.55 to $2.6 in the short term.
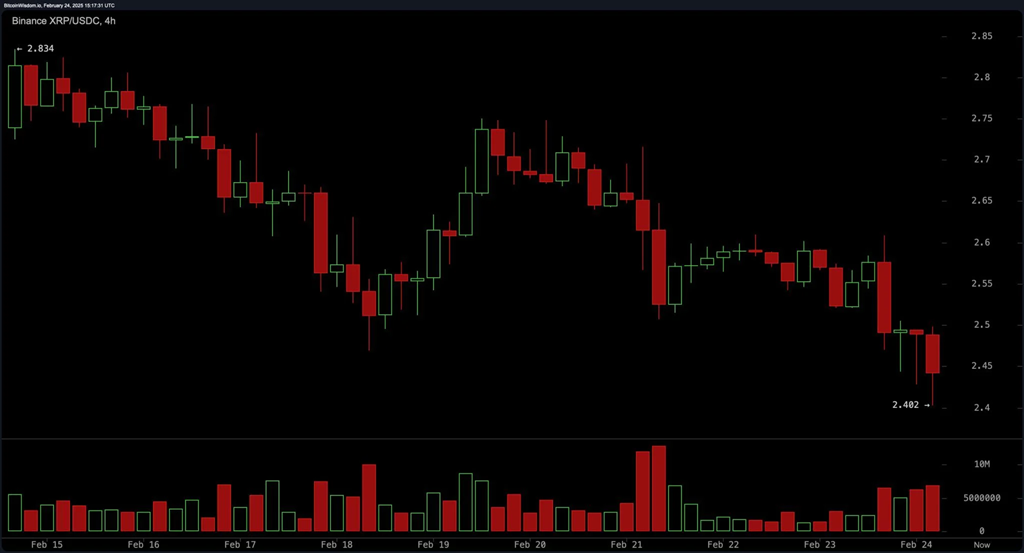
On the four-hour chart, XRP remains in a clear downtrend, having fallen from $2.83 to its current range. Attempts to recover above $2.6 have failed, reinforcing the pattern of lower highs. Increased red volume on recent declines suggests stronger sell-side dominance, while the $2.4 level has held as a key support. A short position could be considered if XRP rejects resistance at $2.55 to $2.6, targeting a drop toward $2.3 to $2.4. A break above $2.6 would challenge the bearish outlook, but confirmation of downward momentum remains a priority for traders.
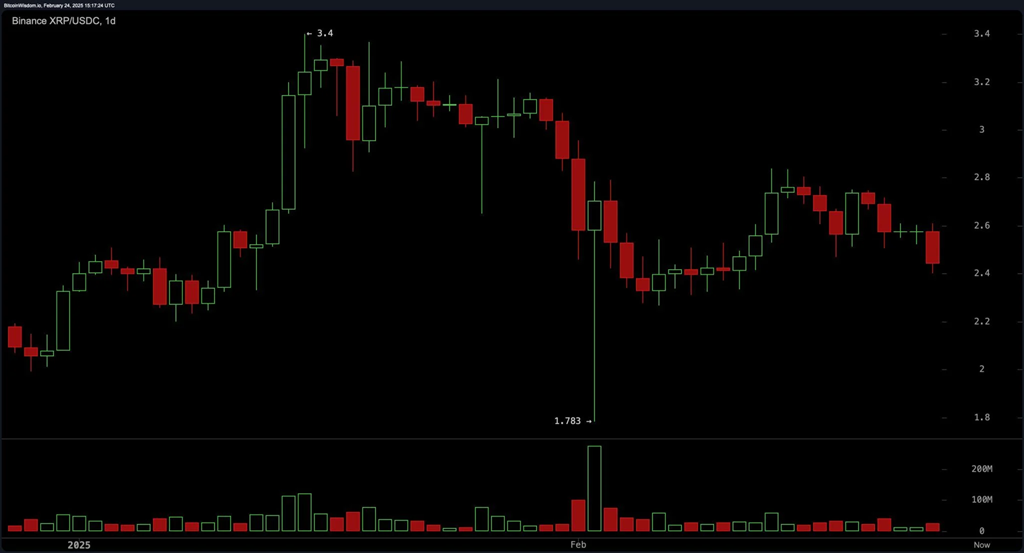
The daily chart highlights a broader trend of declining price action following XRP’s rally to $3.4 and subsequent drop to $1.78. The recent price structure indicates a lower high formation, signaling ongoing bearish pressure despite periodic recovery attempts. The failure to hold above $2.5 increases the risk of further declines, with downside targets extending toward $2.2 or lower. However, if XRP sustains support at $2.4, a potential move toward $2.8 to $3.0 remains possible, though volume trends suggest a cautious approach.
Oscillator readings reflect a mostly neutral stance, with the relative strength index (RSI) at 41.35, Stochastic at 41.11, the commodity channel index (CCI) at -32.28, and the average directional index (ADX) at 30.51. However, the awesome oscillator at -0.118, momentum at -0.287, and moving average convergence divergence (MACD) at -0.037 all indicate a bearish signal, reinforcing the prevailing bearish sentiment.